Guide · 63 min read
The fastest-growing jobs in 2026: the top 10, the top 100 and the jobs in decline
Written by Yuma Heymans, Founder & CEO of AITraining.jobs.
Founder and CEO of AITraining.jobs and co-founder of the AI recruitment platform HeroHunt.ai, based in San Francisco, with years spent mapping how AI-training and data work is sourced, staffed, and paid.
The data-backed guide to where jobs and pay are growing fastest in 2026, where they are disappearing, and the 100 fastest-growing jobs with their numbers
In the 12 months to September 2026, US health care and social assistance added 520,400 jobs. The entire US economy added 496,000 - US Bureau of Labor Statistics. Read that twice: every other industry in the country, taken together, shrank. Meanwhile, an analysis of more than a billion job ads finds that jobs requiring AI skills are growing about eight times as fast as the job market as a whole (69% against 9%), and that the people who hold those skills earn an average 62% pay premium - PwC. Both facts are true at the same time, and they point at two very different answers to the question "what are the fastest-growing jobs right now?"
The problem is that most "fastest-growing jobs" lists answer a narrower question than the one you are probably asking. They rank jobs by percent growth, and percent growth rewards jobs that start small. Solar panel installers are the second-fastest-growing occupation in the official US projections at +36.5%, yet they and wind turbine technicians together will add fewer than 15,000 jobs by 2035 - BLS. Nurse practitioners alone will add 137,800. A list that puts the two side by side without the counts tells you which small job is doubling, not where the work and the money actually are.
This guide answers the bigger question: where are the most jobs being created fastest, and where is the most value being created fastest? It scores ten job categories on four measures (jobs being added now, growth speed, pay per job and total value), walks through each one with current data, then covers the fastest-declining jobs worldwide, and ends with the 100 fastest-growing jobs in the US projections with their numbers. Every figure is linked to its source and was checked on October 6, 2026. One of the ten categories, paid work training and testing AI models, is what this site tracks every day: AITraining.jobs lists 3,684 open roles today from the platforms whose public job feeds it reads.
Contents
- How to measure job growth: speed, volume and value
- Where jobs are being created right now
- No. 1: Healthcare clinicians
- No. 2: Building trades for data centers, power and factories
- No. 3: AI engineers and researchers
- No. 4: Elder and disability care
- No. 5: Health system management and billing
- No. 6: AI consultants and strategists
- No. 7: AI training data work
- No. 8: Cybersecurity
- No. 9: Founders and solo businesses
- No. 10: Mental and behavioral health
- The fastest-declining jobs worldwide
- The 100 fastest-growing jobs, with numbers
- How to use this ranking
The top 10 at a glance
The table below is the whole ranking on one screen. Each category is scored from 0 to 10 on four measures, and each score sits next to the number that earned it, so you can disagree with a score and still see the evidence. Jobs added now carries the most weight (30%) because the question is where the most jobs are being created, and payroll counts are the hardest evidence there is. Speed carries 20% because percent growth is the noisiest measure: it flatters small jobs. Pay per job and total value carry 25% each, because a job that pays $36,000 and a job that pays $136,000 do not create the same amount of value, and because some categories are pulled forward by enormous flows of money before the payroll numbers catch up.
The final score is the weighted average, and the rows are sorted by it. Two patterns stand out before you read a single section. Healthcare clinicians score high on all four measures at once, which is rare, and it is why they lead. AI engineers win speed and pay outright but lose on volume, because the number of people doing that work is still small. Elder care is the mirror image: it adds jobs as fast as anything in the economy, but the pay is low. Most categories in the middle of the table are a trade between those two shapes.
| # | Category | What it covers | Jobs added now (30%) | Speed (20%) | Pay per job (25%) | Total value (25%) | Final |
|---|---|---|---|---|---|---|---|
| 1 | Healthcare clinicians | Nurse practitioners, physician assistants, nurses, therapists | 10 - hospitals +108,100 and outpatient care +132,600 in 12 months | 9 - nurse practitioners +41%, the fastest US job to 2035 | 8 - NP $132,300, PA $135,880, RN $97,550 median | 10 - about $45B a year of new pay by 2035 | 9.3 |
| 2 | Building trades | Electricians, builders, engineers, data center technicians | 8 - about 187,000 in 12 months across five construction, engineering and electrical industries | 6 - +2.2% to +4.0% a year by industry | 6 - electricians $63,190 median, $120,000+ in data center hubs | 10 - $735 to 750B of 2026 capex at four companies | 7.6 |
| 3 | AI engineers and researchers | AI and ML engineers, AI researchers, data scientists | 3 - small base, and US tech payrolls are still shrinking | 10 - AI-skill job ads +69% vs +9% overall | 10 - 62% average AI pay premium | 7 - data scientists alone add about $11.5B a year by 2035 | 7.2 |
| 4 | Elder and disability care | Home health aides, personal care aides | 10 - home health +80,700 and family services +152,800 in 12 months | 7 - +4.5% and +4.2% in one year | 2 - $35,800 median | 8 - +847,300 aides, about $30B a year of new pay | 6.9 |
| 5 | Health management and billing | Health services managers, reimbursement specialists | 5 - +155,100 managers by 2035 | 7 - +24.2%, LinkedIn's No. 6 rising role | 8 - $123,860 median | 7 - about $19B a year of new pay by 2035 | 6.7 |
| 6 | AI consultants and strategists | AI consultants, strategic advisors, management analysts | 4 - consulting firms +28,100 in 12 months | 9 - LinkedIn's No. 2 rising role | 7 - management analysts $101,860 median | 5 - about $11B a year of new pay by 2035 | 6.0 |
| 7 | AI training data work | Data annotators, expert AI trainers | 4 - 3,684 open roles tracked here today | 8 - LinkedIn's No. 4 rising role | 6 - $65 an hour median advertised rate | 4 - one platform paid out $1.5M+ a day (October 2025) | 5.3 |
| 8 | Cybersecurity | Information security analysts and managers | 3 - +40,600 analysts by 2035 | 6 - +21.0% | 8 - $129,180 median | 4 - about $5B a year of new pay by 2035 | 5.1 |
| 9 | Founders and solo businesses | Founders, independent operators | 6 - 6.19 million business applications in the 12 months to August 2026, a record | 6 - LinkedIn's No. 9 rising role, filings +13.5% this year | 3 - unproven, only 7% plan to pay wages | 3 - not measurable yet | 4.5 |
| 10 | Mental and behavioral health | Counselors, psychiatric technicians and nurse practitioners | 4 - +134,000 jobs by 2035 | 6 - +18.4% and +22.3% | 4 - $59,350 and $45,130 median | 4 - about $7B a year of new pay by 2035 | 4.4 |
How to read the four columns: jobs added now uses US payroll data for the 12 months to September 2026 where the category maps to an industry, and the projected pace or the best live count where it does not. Speed uses percent growth from the official 2025-2035 projections, LinkedIn's Jobs on the Rise ranking of the fastest-growing job titles, and PwC's count of AI job ads. Pay per job uses median annual pay or a measured pay premium. Total value multiplies projected new jobs by median pay to get the new yearly pay a category will create, or uses the money flowing into it where that is the bigger signal. Every number in the table is sourced in the section that covers it.
The gaps between scores matter more than the scores themselves. The distance between first and second place (9.3 against 7.6) is larger than the distance between second and fifth, which tells you that healthcare is in a class of its own on these measures while the next four are close enough that your own situation should decide between them. The bottom of the table is not a list of bad options either. Founders and mental health workers score lower because their value is harder to measure or their pay is lower, not because the work is shrinking: both are growing faster than the economy as a whole.
1. How to measure job growth: speed, volume and value
A job exists when someone is willing to pay for an outcome that still needs a person to deliver it. That simple fact explains almost every pattern in this guide. Jobs grow fastest where spending on an outcome grows faster than the productivity of the people who deliver it, and they shrink where software or machines raise productivity faster than demand grows. Patient care is a clear example of the first: an aging population wants more of it every year, and a nurse can only see so many patients in a shift. Data entry is a clear example of the second: the outcome (information moved from one form to another) is still wanted, but software now delivers most of it without a person.
In 2026 three forces are pushing money toward human work faster than productivity can absorb it. The first is aging, which pushes up spending on care that is hard to automate. The second is AI investment, which is pouring hundreds of billions of dollars into physical buildings, power and chips, and into a smaller number of very highly paid technical roles. The third is cheaper company-building: software and AI tools have lowered the cost of starting a business so far that new business applications in the US are at record highs. Each force creates a different kind of job, and each looks different depending on which measure you use.
The three measures are worth separating clearly, because most confusion about "fastest-growing jobs" comes from mixing them:
- Speed is percent growth. It tells you which jobs are expanding fastest relative to their own size.
- Volume is the number of jobs added. It tells you where the most people are actually being hired.
- Value is pay multiplied by jobs, plus the money flowing into a field. It tells you where the economic weight is.
Each measure misleads when it is used alone. Speed puts small, fast-moving jobs at the top: the official projections rank wind turbine technicians fourth by growth rate, but the whole occupation will add only 3,500 jobs in ten years - BLS. Volume puts large, low-paid jobs at the top: the job adding the most positions in the US through 2035 is home health and personal care aides, at +847,300, with a median wage of $35,800. Value on its own can hide where the jobs actually are, because a field like AI research can create enormous value with very few people. Reading all three together is the only way to see the whole picture.
The global picture shows the same tension even more starkly. The World Economic Forum's survey of more than 1,000 employers projects that farmworkers will add about 35 million jobs worldwide by 2030, more than any other occupation, driven mainly by green-transition investment, according to the report - World Economic Forum. The chart below, from the same report, ranks jobs by the absolute number of positions they are expected to gain or lose. Compare it with any percent-growth list and almost none of the names overlap.
The largest growing and declining jobs worldwide, 2025-2030

The top of that chart is dominated by work that keeps economies running day to day: farmworkers, delivery drivers, software developers, building framers and finishers, shop salespeople, food processing workers and nursing professionals. The bottom is dominated by clerical work: cashiers and ticket clerks are expected to lose the most jobs of any role in the world, followed by administrative assistants and executive secretaries. That split is the first clue to the whole guide: work that moves physical things or cares for people is growing, while work that moves information from one place to another is shrinking.
Value is the measure most lists ignore, so it is worth putting a number on it. Multiplying each US occupation's projected new jobs by its median pay gives the new yearly pay the occupation will create by 2035. The chart below shows the eight largest. It mixes very different kinds of work: the low-paid but enormous aide workforce, a handful of high-paid technical and management roles, and clinical roles that are both large and well paid.
Four of the eight are health jobs, and together they add about $87 billion a year of new pay. Software developers rank second on value even though their growth rate (10.2%) is unremarkable, simply because they are numerous and well paid. Notice also what is missing: only two of the ten fastest-growing jobs by percent make this list (nurse practitioners and medical and health services managers). The jobs that will create the most value are mostly large occupations growing at a steady clip, not small ones growing fast.
The diagram below pulls the three forces together. It shows where the money comes from and which kinds of jobs it ends up paying for, which is the structure the rest of this guide follows.
Three forces push money toward human work faster than productivity absorbs it
Why this matters: if you choose a career or a hiring plan from a percent-growth list, you will over-weight small, fashionable jobs and under-weight the large ones where most of the hiring happens. How to apply this: for any job you are considering, look up all three numbers (percent growth, jobs added and median pay) before deciding, and ask which of the three forces in the diagram is paying for it. A job paid for by a force that keeps growing for a decade is a safer bet than one riding a single hiring cycle.
2. Where jobs are being created right now
The current US job market is narrow. Total payroll employment rose by only 496,000 in the 12 months to September 2026, an average of about 41,000 a month, and the September report itself showed just 29,000 new jobs with unemployment at 4.2% - BLS. Within that thin total, the gains are concentrated in a few places. Health care added 371,800 jobs over the year, about three-quarters of the net total on its own, and social assistance (mostly services for older and disabled people) added another 148,600.
The rest of the economy is split between modest growth and real losses. Construction added 109,000 jobs and professional, scientific and technical services added 83,000, while government shed 216,000, the information sector (publishing, software publishing, film, telecom and data hosting) lost 120,000, and finance and insurance lost 93,300. The chart below shows the eight largest moves in either direction. It is the clearest picture of what is actually happening in hiring this year, as opposed to what forecasts say should happen.
Three things in that chart deserve attention. First, the health and care engine is not a forecast; it is the only part of the economy adding jobs at scale today, although it is slowing: health care added 17,000 jobs in September against an average of 33,000 a month over the prior year. Second, the information sector is shrinking at 4.2% a year even as AI dominates the headlines, which says that AI is changing which tech jobs exist faster than it is adding to their number (section 5 explains how). Third, construction is growing in exactly the places the AI buildout touches: nonresidential building, specialty trades such as electrical work, and heavy and civil engineering (section 4).
The official ten-year projections, released on August 27, 2026, point the same way. The Bureau of Labor Statistics expects the US to add 5.9 million jobs from 2025 to 2035, and expects private health care and social assistance to add more than 2.2 million of them, about 37% of all new jobs, because of the aging population and the rising prevalence of chronic disease - BLS. Professional, scientific and technical services come second with 926,700 new jobs, and the bureau names the cause directly: demand for AI-based systems, research and development, and the consulting services that go with them. The fastest-growing sector by percent is utilities (+9.8%), driven almost entirely by electricity demand, including the power appetite of AI.
The global outlook rhymes with the US one. The World Economic Forum estimates that trends in technology, demographics, the economy and the green transition will create 170 million jobs and displace 92 million by 2030, a net gain of 78 million, with job churn equal to 22% of today's formal employment - World Economic Forum. The fastest-rising job titles also look similar across countries: AI engineers are the fastest-growing role in the UK in LinkedIn's 2026 ranking - LinkedIn UK, and in India the top two are prompt engineers and AI engineers - LinkedIn India.
The practical summary of this section fits in three sentences:
- Volume today is in health care, social assistance and construction.
- Speed today is in AI roles, which grow fast from a small base across many countries.
- Losses today are in government, information, and finance and insurance.
Those three lines are the frame for the ranking that follows. The categories at the top of the top 10 sit where volume and value overlap (clinicians and the buildout trades), the middle is where speed and pay are high but volume is modest (AI engineers, consultants and trainers), and the categories that lose jobs belong to section 13. Why this matters: a job search or a training plan aimed at where hiring is happening now has a much better chance than one aimed at headlines. How to apply this: before you invest a year in retraining, check the latest payroll trend for the industry you are aiming at, not just its ten-year projection, and favor fields where both point up.
3. No. 1: Healthcare clinicians
Healthcare clinicians rank first because they are the only category that scores high on every measure at once: they are being hired in large numbers today, they are among the fastest-growing jobs in the projections, they are well paid, and the total pay they will add is the largest of any group. In the 12 months to September 2026, US hospitals added 108,100 jobs and outpatient care (doctors' offices, clinics, outpatient centers and similar settings, excluding home health) added about 132,600 - BLS. No other part of the economy adds skilled jobs at that pace, and very few add jobs at all.
The projections show where inside healthcare the growth is concentrated. Nurse practitioners are the fastest-growing occupation in the entire US economy, projected to grow from 336,300 to 474,100 jobs (+41.0%) by 2035 at a median pay of $132,300, which the Bureau of Labor Statistics attributes to "the central role this occupation plays in providing care under collaborative, team-based models of care" - BLS. Physician assistants grow 21.1% at $135,880, and registered nurses, already one of the largest occupations in the country, add 194,700 jobs at a median of $97,550. Healthcare support and healthcare practitioner jobs are the two fastest-growing occupational groups of all 22, and together they account for almost one-third of all new US jobs projected through 2035.
The structural reason is worth spelling out, because it explains why this growth is durable. Demand for care rises with age and with chronic disease, and both are rising in nearly every rich country at once. Supply, meanwhile, is constrained by training pipelines that take years: a nurse practitioner needs a nursing degree, clinical experience and a graduate program before practicing. And productivity in hands-on care grows slowly, because a patient visit cannot be compressed the way a spreadsheet can. When demand compounds, supply lags and productivity is sticky, employers have no option but to hire. That is exactly the pattern in the payroll data.
The roles growing fastest inside clinical care share a profile: advanced training, a license, and a scope of practice that lets one person handle work that used to need two. Here are the clearest examples in the projections:
| Role | Growth to 2035 | Jobs added | Median pay |
|---|---|---|---|
| Nurse practitioners | +41.0% | +137,800 | $132,300 |
| Physical therapist assistants | +23.0% | +26,200 | $68,380 |
| Occupational therapy assistants | +21.5% | +11,200 | $72,300 |
| Physician assistants | +21.1% | +35,700 | $135,880 |
| Speech-language pathologists | +16.6% | +32,100 | $97,870 |
Notice the two types on that list. The first is the "doctor-extender" role (nurse practitioners and physician assistants), which takes on diagnosis and treatment work that health systems can no longer staff with physicians alone. The second is the therapy assistant, which multiplies the reach of a licensed therapist across more patients. Both types grow because they let the system serve more people per expensive credential, which is the most valuable thing a clinician can do when demand outruns supply. If you are choosing a clinical path, the roles that extend a scarce professional's reach are the ones the projections reward most.
The global picture is, if anything, more extreme. The World Health Organization projects a shortfall of 11.1 million health workers by 2030, mostly in low- and lower-middle-income countries - WHO, and the World Economic Forum lists nursing professionals among the largest-growing jobs worldwide by absolute numbers. Clinical work is also one of the few areas where postings have held up since the 2022 peak: in Indeed's comparison of job postings between May 2022 and May 2026, physicians and surgeons were the only occupation group shown to finish above their 2022 level, while the groups most exposed to AI fell the most - Indeed Hiring Lab.
There are honest limits to this picture. Health care hiring slowed to 17,000 jobs in September 2026 from an average of 33,000 a month, and the long training pipelines that protect clinicians' pay also make the field slow to enter. Pay varies widely by state and setting, and burnout in hospital roles is a real reason people leave. None of that changes the direction of demand, but it does mean that the best-positioned people are those who can reach a licensed, advanced role, not those who enter at the lowest rung and stay there.
Clinicians also have a second market that most career guides ignore. AI companies now pay licensed professionals to test and correct their models' medical reasoning, and on this site's live board the law, medicine and finance category shows 1,118 open roles and a median advertised rate of $70 an hour, with listings for psychiatrists and psychologists among them. The remote healthcare roles page lists every open AI-training role for health professionals with the pay each one states, and the domain expert pay page shows the full range. For a clinician, this is a way to earn on the side from the same expertise the labor market already rewards.
Why this matters: no other category combines this much hiring with this much pay, and the demand behind it compounds every year rather than following a business cycle. How to apply this: if you are early in a career, aim for a licensed role that extends a scarce professional's reach (nurse practitioner, physician assistant, therapy roles); if you are already a clinician, the fastest raises tend to come from moving up a scope-of-practice level rather than from switching employers at the same level.
4. No. 2: Building trades for data centers, power and factories
The second-largest engine of new jobs is physical: the buildings, power lines and equipment that the AI boom and the electrification of the economy require. In the 12 months to September 2026, five industries at the heart of that buildout added roughly 187,000 jobs between them: nonresidential specialty trade contractors such as electrical and mechanical firms (+67,700, measured to August), architectural and engineering firms (+45,000), nonresidential building construction (+31,000), heavy and civil engineering construction (+26,300), and electrical equipment manufacturing (+17,300, a growth rate of 4.0%) - BLS. Those are not forecasts; they are payroll counts.
The money behind that hiring is the largest private investment wave in modern history. Amazon, Google, Meta and Microsoft now guide to a combined $735 to 750 billion of capital spending in 2026, up from more than $640 billion at the start of the year, and in the second quarter alone they spent almost $172 billion, 77% more than a year earlier - Platformonomics. Most of that is servers, chips and data centers, and Amazon told investors that even at about $220 billion of spending it would "still not have enough capacity to meet all the demand" in 2026. Every dollar of it that becomes a building needs electricians, pipefitters, ironworkers, engineers and commissioning specialists before a single chip is installed.
Electricians sit at the center of this, because power is the binding constraint on every data center. Electrical work accounts for 45% to 70% of the cost of building a data center, a single facility can need up to 1,500 workers at peak construction, and projections suggest the US needs more than 300,000 new electricians over the next decade to meet AI-driven demand while about 20,000 retire every year - Fortune. Microsoft's president Brad Smith has called the shortage of electrical talent the number one problem slowing the company's data center expansion in the US. The trade's own numbers show the pressure: the electricians' union local around northern Virginia, the densest data center market in the world, has doubled its membership since 2018 to more than 14,700, and journeymen there earn about $59.50 an hour, more than $120,000 a year before overtime.
The scale of individual projects explains why local labor markets cannot keep up. In a decade, data center budgets have jumped from an average of under $500 million to more than $10 billion, and Meta's campus in Holly Ridge, Louisiana covers 2,700 acres with a budget of about $10 billion, four times larger than any data center the company had built before - IBEW. The local union there has 500 members. A project like that pulls workers from hundreds of miles away and keeps them for years, which is why pay and overtime in these trades have risen faster than in construction as a whole.
Fortune's video report from March 2026 shows what the shortage looks like on the ground, from the apprentices entering the trade to the companies competing for them. It is worth watching for the scale of the sites alone, which is hard to convey in numbers.
The electrician shortage behind the AI data center boom
The long-run projections back up what the payroll data shows. The Bureau of Labor Statistics expects utilities to be the fastest-growing sector of the economy (+9.8%) because of rising electricity demand, including AI's, and expects 4 of the 10 fastest-growing industries to be driven largely by electricity demand. Inside the trades, these are the roles with the clearest outlook to 2035:
| Trade | Growth to 2035 | Jobs added | Median pay |
|---|---|---|---|
| Industrial machinery mechanics | +17.8% | +79,700 | $64,520 |
| HVAC mechanics and installers | +10.9% | +48,200 | $61,010 |
| Electrical power-line installers | +10.3% | +13,600 | $95,320 |
| Electricians | +9.2% | +75,900 | $63,190 |
| Construction managers | +9.1% | +55,200 | $114,990 |
Those national medians understate what the buildout pays where it is concentrated, which is why the scoring table gives this category a 6 on pay rather than a 4. They also understate the new job titles the buildout is creating: LinkedIn's 2026 list of the fastest-growing US job titles includes commissioning managers at No. 11, datacenter technicians at No. 17 and construction project leads at No. 22 - LinkedIn. Globally, the World Economic Forum ranks building framers, finishers and related trades among the five largest-growing jobs in the world by 2030.
One detail in the data is easy to miss and important. The industry that runs data centers once they are built (computing infrastructure, data processing and web hosting) is projected to grow 25.1% by 2035, yet its payrolls actually fell by 22,500 in the 12 months to September 2026. The jobs, in other words, are in building these facilities, not in running them: a finished data center employs a small fraction of the people who built it. That makes the buildout trades excellent work while the investment wave lasts, and it is why the strongest position in this category is a portable license (electrician, HVAC, power-line work) that transfers to hospitals, factories, power plants and the grid when data center construction slows.
Why this matters: this is the one part of the AI economy that creates large numbers of well-paid jobs without a degree, and it is constrained by a shortage of people rather than a shortage of money. How to apply this: an apprenticeship in electrical, HVAC or power-line work pays from the first day and leads to a license that the whole economy needs; applications for commercial electrical apprenticeships rose by more than 70% between 2022 and 2024 - Fortune, so apply early and widely, and favor programs tied to unions or large contractors with data center and utility work.
5. No. 3: AI engineers and researchers
AI engineers and researchers are the fastest-growing and best-paid category in this guide, and the reason they rank third rather than first is volume: there are still relatively few of them. The growth itself is not in doubt. PwC's analysis of more than a billion job ads in 27 countries found that jobs requiring specific AI skills (machine learning, prompt engineering and similar) grew roughly eight times as fast as the job market as a whole, that the number of AI jobs is almost twice its 2024 level, and that the average wage premium for AI skills rose to 62% from 57% a year earlier - PwC. The premium ranges from 118% in consumer markets to 16% in government.
The job-title data says the same thing in every large market. AI engineers (also called machine learning engineers) top LinkedIn's 2026 list of the fastest-growing US job titles, and AI and machine learning researchers rank fifth. AI engineers are also first in the UK, and in India the top two are prompt engineers and AI engineers. The World Economic Forum's employers expect big data specialists, fintech engineers and AI and machine learning specialists to be the three fastest-growing jobs in the world through 2030, with big data specialists more than doubling. In the US projections, data scientists grow 34.6% to 2035 (from 275,600 to 371,000 jobs) at a median of $120,230, and computer and information research scientists grow 21.8% at $140,300 - BLS.
Here is the paradox that makes this category hard to read. While AI roles are the fastest-growing jobs on every list, US tech employment is shrinking. In the 12 months to September 2026, the information sector lost 120,000 jobs, publishing (which includes software publishers) lost 32,600, and computer systems design lost 32,200. The resolution is that AI is reshaping who tech companies hire faster than it is increasing how many people they hire. Generalist and junior roles are being cut or not backfilled, while senior people who can build with AI are in short supply.
Indeed's data on software development postings shows that reshaping directly. US software development postings have risen almost 15% since late February 2025, when agentic coding tools such as Claude Code became widely available, while job postings overall fell 7%; yet they remain about 27.5% below their pre-pandemic level - Indeed Hiring Lab. The rebound is narrow, as the chart below shows: senior roles account for 71% of the increase and roles with "AI" in the title for 37%.
The software rebound is concentrated in senior and AI roles
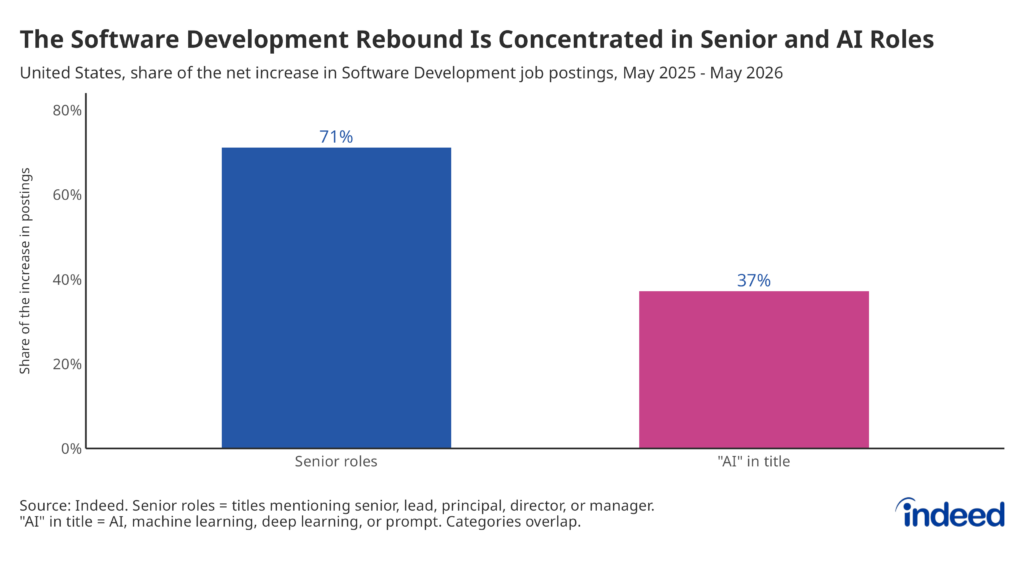
Read that chart together with PwC's finding on entry-level work and the shape of this category becomes clear. PwC's analysis of 2.4 million US entry-level jobs found that the entry-level roles most exposed to AI are seven times more likely to require traditionally senior skills such as judgment and leadership, and that those roles grew 35% since 2019 while other entry-level roles declined 10%. Employers are not hiring fewer AI-capable people; they are asking even their junior hires to do senior work. A new graduate who can only write code to a specification competes with tools that do that cheaply, while one who can decide what to build and check whether an AI system did it correctly is in demand.
The value created by this category goes well beyond its own payroll. PwC found that companies most able to use AI grew headcount faster than the least AI-exposed companies (52% against 36% since 2018) and raised wages faster (24% against 17%), and that the top fifth of AI-exposed companies grew labor productivity by 163% relative to 2018. AI engineers are the people who make that possible, which is why their pay sits at the top of every scale in this guide. Their value shows up in other people's productivity as much as in their own salaries.
There are three realistic routes into this category, and they suit different starting points:
- From software engineering, by moving into machine learning, AI product engineering or evaluation work
- From data or analytics, by moving from reporting into modeling and AI systems
- From research, through graduate study in machine learning or a field that uses it heavily
The common thread is that each route starts from real technical depth and adds AI on top, rather than starting from an AI course with nothing underneath. Hiring data rewards that combination: the senior-heavy rebound in Indeed's postings and PwC's finding that AI roles demand senior skills both say that employers pay for judgment applied to AI, not for familiarity with AI tools alone. If you are not technical, sections 8 and 9 describe the AI-adjacent categories that reward domain expertise instead.
Why this matters: this category creates the most value per person of anything in the economy, and its premium is still rising. How to apply this: build depth in one technical field first, then add hands-on AI work you can show (projects, evaluations, systems you shipped); for hiring managers, the evidence says to look for judgment and seniority signals rather than tool familiarity, because that is what the market is paying for.
6. No. 4: Elder and disability care
Elder and disability care adds jobs faster than almost anything else in the economy, and it ranks fourth only because the pay is low. In the 12 months to September 2026, individual and family services (the industry that provides most in-home and community care for older and disabled people) added 152,800 jobs, a growth rate of 4.2%, and home health care services added 80,700 jobs, a growth rate of 4.5%, roughly double the pace of health care as a whole - BLS. Over the next decade, home health and personal care aides are projected to add 847,300 jobs, more than any other occupation in the country, growing from 4.68 million to 5.52 million workers.
The industry projections make the same point from another angle. The Bureau of Labor Statistics expects services for the elderly and persons with disabilities to add 625,400 jobs from 2025 to 2035, "the most of any detailed industry", driven by increased demand for home-based care - BLS. The trend is global: the World Economic Forum lists personal care aides among the 15 largest-growing jobs worldwide by 2030, as aging populations in higher-income countries push up demand for care.
The economics of this work explain both its growth and its pay. Care is almost purely time-based: helping someone bathe, dress, eat, take medication and move safely takes the same number of minutes no matter how much technology surrounds it, so productivity barely rises while demand rises every year with the number of older people. That is why the job count grows so reliably. But the work is paid largely by public programs and by families on fixed incomes, so wages are held down: the median for home health and personal care aides is $35,800 a year. Even so, the occupation will add more new yearly pay (about $30 billion by 2035) than any other single occupation, simply because of its size.
Why this matters: this is the largest and most recession-resistant source of new jobs in the economy, and it is also one of the clearest entry points into health care that requires no degree. How to apply this: treat aide work as a first step rather than a destination; the roles one or two steps up the same ladder (medical assistants, licensed practical nurses, registered nurses) pay substantially more and are also growing, with medical assistants alone projected to add 107,600 jobs at a median of $45,690. For employers and families, the data says competition for good aides will only intensify, so retention (scheduling, pay and training) is worth more than recruitment.
7. No. 5: Health system management and billing
The fifth category is the business side of health care: the managers, administrators and billing specialists who keep a fast-growing and increasingly complex system running. Medical and health services managers are the fifth-fastest-growing occupation in the country, projected to grow 24.2% from 640,400 to 795,500 jobs by 2035 at a median of $123,860 - BLS. That growth will add about $19 billion a year of new pay, more than almost any other occupation.
On the billing side, healthcare reimbursement specialists are the sixth-fastest-growing job title in the US in LinkedIn's 2026 ranking. They manage the claims, denials and payer rules that determine whether a health system gets paid for the care it delivers, which makes them one of the most direct links between the care a system provides and the money it collects. Health information technologists and medical registrars are projected to grow 15.9%, while medical records specialists, a more routine records role, grow only 7.8%, which places them at No. 100 on the top 100 list in section 14.
That contrast is the lesson of this category. The administrative roles that grow fastest are the ones that require judgment about money, rules and operations, while the purely clerical records roles grow slowly because software handles more of them. Health systems are growing so quickly that even administrative work expands, but within it, the value is moving toward people who can run a department, fight a denied claim or manage a revenue cycle, and away from people who only enter data.
Why this matters: this is one of the few routes into health care's growth that does not require clinical training, and it pays well at the management level. How to apply this: if you come from operations, finance or administration in another industry, health care management is a natural move, and certifications in revenue cycle or health information management shorten the path; if you work in medical records today, moving toward reimbursement, compliance or analytics protects you from the automation squeezing routine records work.
8. No. 6: AI consultants and strategists
The sixth category exists because most companies have bought AI but have not yet made money from it. PwC's survey of 1,217 senior executives found that nearly three-quarters (74%) of AI's economic value is being captured by just one-fifth (20%) of organizations, while the majority of businesses are "still stuck in pilot mode" - PwC. That gap between AI leaders and everyone else is a market, and it is being filled by people who can turn pilots into working processes: AI consultants, AI strategists and the internal leaders who do the same job inside companies.
The job-title data shows how fast that market is growing. AI consultants and strategists are the second-fastest-growing job title in the US in LinkedIn's 2026 ranking, behind only AI engineers, and strategic advisors and independent consultants rank seventh. In the UK the second-fastest-growing title is head of AI, and in India managers of artificial intelligence rank fourth. The World Economic Forum's employer survey points the same way: half of employers plan to reorient their business in response to AI and two-thirds plan to hire talent with specific AI skills - World Economic Forum.
The official statistics confirm that this is real hiring rather than relabeling. The Bureau of Labor Statistics expects professional, scientific and technical services to add 926,700 jobs by 2035 and names "demand for AI-based systems, research and development, and associated consulting services" as the driver. Management analysts, the occupation that covers most consultants, are projected to add 109,200 jobs at a median of $101,860, and training and development specialists, who teach organizations to use new tools, grow 10.8%. In the 12 months to September 2026, management, scientific and technical consulting firms added 28,100 jobs, one of the few white-collar industries growing while information and finance shrank.
What separates successful people in this category from the rest is domain knowledge. A consultant who understands claims processing, supply chains or legal workflows can redesign that work around AI, while a generalist who only knows the tools has little to offer that the tools' own vendors do not. The fastest path in is usually from inside an industry: the operations manager who led an AI rollout in their own company is exactly the profile clients and employers are hiring.
Why this matters: this category converts AI's potential into revenue, which is why companies pay well for it, and it is open to people whose main asset is industry experience rather than engineering skill. How to apply this: lead or join an AI project in your current role, measure the result in money or hours saved, and use that case as your credential; the pay and demand data favor consultants who can show a before-and-after number in a specific industry over those who can only describe what AI can do in general.
9. No. 7: AI training data work
AI training data work is the job category the AI boom created from almost nothing, and it is the one this site exists to track. It covers the people who label data, rate and compare AI answers, write the reference answers models learn from, and test models for mistakes and unsafe behavior. Data annotators are the fourth-fastest-growing job title in the US in LinkedIn's 2026 ranking, described as people who label and review data against detailed guidelines and quality checks so AI models train on accurate examples, often on a per-project basis - LinkedIn. It ranks seventh in this guide because the work is real and growing fast, but much of it is project-based contract work rather than steady employment, which keeps its volume and total value scores modest.
The live numbers show a market that is both large and sharply tiered. Today AITraining.jobs lists 3,684 open roles, with a median advertised rate of $65 an hour and a typical range of $35 to $120 an hour. As the site's pay data puts it, the same hour can be worth $4 labeling images or $200 writing formal math proofs. That spread is the single most important fact about this category: it is not one job but a ladder, and where you stand on it depends almost entirely on what expertise you bring.
The money comes from AI labs that need human judgment to make models better, and it has grown fast. One platform alone, Mercor, said in October 2025 that it was paying more than $1.5 million a day to the contractors on its roster, which then counted more than 30,000 experts earning over $85 an hour on average - TechCrunch. The same report described the company's pivot from an AI hiring platform to supplying scientists, doctors and lawyers to train foundation models, and its valuation of $10 billion. Platforms like Mercor, micro1 and Braintrust now screen applicants with an AI-run interview, which this site explains step by step in its guide to passing an AI interview.
The tiers are clearest in the live medians this site publishes for each kind of work. These five show the range from entry-level to expert:
| Kind of work | Open roles | Median advertised rate |
|---|---|---|
| Law, medicine and finance | 1,118 | $70 an hour |
| Coding and software evaluation | 285 | $65 an hour |
| AI evaluation and rating | 143 | $60 an hour |
| Multilingual and localization | 1,005 | $65 an hour |
| Data annotation and labeling | 140 | $30 an hour |
The pattern matches what PwC found across the whole labor market: roles where AI makes experts more valuable ("professionalised" roles) are seeing twice the job growth and 42% faster salary growth than roles where AI makes the work easier for anyone to do. In AI training, routine labeling is the second kind of work. AI tools increasingly pre-label simple data, so the budgets shift toward verifiable expert judgment: a licensed professional checking a model's legal reasoning, a mathematician writing proofs, an engineer grading code. The law, medicine and finance roles, the coding roles and the newer agentic task roles sit at the top of the ladder for exactly that reason, while data labeling stays accessible but geography-priced.
The honest limits of this category matter as much as its upside. Most of the work is contract work with no guaranteed hours: passing a platform's screening puts you in a pool, and money starts only when a project needs your profile. Projects end when a lab's needs change, and pay advertised as a range is not the same as pay received. The State of AI Training Pay report on this site covers which work pays most, the pay gap and how many roles publish a rate at all, the highest-paying platforms ranking compares the platforms, and the earnings calculator turns the published rates into your own number.
Where this category fits in a career is the key judgment. For people who already have expertise (a license, a degree, years in a field), AI training work is one of the best-paid ways to earn on the side from that expertise. For people without specialized expertise, it is a flexible source of income but rarely a career on its own, because the entry-level tier is where automation bites first. The kinds of work and what each one involves day to day are explained in the learning guides, starting with data labeling and AI evaluation and rating.
Why this matters: this is the most direct way for non-engineers to earn from the AI boom, and the best-paid tier rewards exactly the expertise that also protects people from AI elsewhere in the labor market. How to apply this: lead with your strongest credential, apply to the platforms whose open roles match it, prepare properly for the screening, and treat the income as a supplement until you have seen several months of steady projects.
10. No. 8: Cybersecurity
Cybersecurity ranks eighth because it pairs fast growth and high pay with a small number of total jobs. Information security analysts are projected to grow from 192,900 to 233,400 jobs by 2035, a rise of 21.0% at a median pay of $129,180, which makes the occupation the 12th-fastest-growing in the US - BLS. Globally, the World Economic Forum's employers list security management specialists fifth and information security analysts 13th among the 15 fastest-growing jobs through 2030, and they rank "networks and cybersecurity" as the second-fastest-growing skill area after AI and big data.
The structural driver is simple: everything this guide describes as growing creates more to defend. Every new data center, every AI system connected to company data, every clinic that moves records to the cloud and every new small business that runs on software adds systems that someone has to secure. The value of what is being protected rises too, which is why pay in this field stays high even as its headcount grows. The same AI tools that help defenders also lower the cost of attacks, so the work keeps changing rather than becoming routine.
The category's limit is that it is still a fairly small occupation: the 40,600 new analyst jobs projected over a decade add up to about $5 billion a year of new pay, a fraction of what nurses or software developers will add. Entry can also be harder than shortage headlines suggest, because many security job postings ask for experience that is difficult to get without a first security job. The common path runs through IT support, network administration or software development, with certifications along the way.
Why this matters: demand for security grows with every other trend in this guide, and the field is less exposed to automation than most office work because its adversaries adapt. How to apply this: if you work in IT, move toward security responsibilities in your current job before trying to switch titles; if you are starting out, a role in IT support or networking plus a recognized security certification is the most reliable route in.
11. No. 9: Founders and solo businesses
The ninth category is people creating their own jobs. Americans filed 5.67 million applications to start a business in 2025, a record and 62% more than in 2019, and the pace has accelerated in 2026: applications in the first eight months were 13.5% higher than a year earlier, and the 12-month total passed 6 million for the first time in June 2026, reaching 6.19 million in the 12 months to August - US Census Bureau. Founders are also the ninth-fastest-growing job title in LinkedIn's 2026 US ranking, with strategic advisors and independent consultants at seventh and venture partners at 12th.
The first-principles explanation is the cost of starting. A business that once needed developers, designers, a bookkeeper and an agency can now be started by one person using software and AI for most of that work, so the fixed cost of trying an idea has collapsed. When something gets cheaper, people do more of it, and business formation is no exception. The same force explains the most striking number in the Census data: in the 12 months to August 2026 only about 7% of new business applications said they planned to pay wages, down from 13.7% in 2019. More businesses are being started than ever, and fewer of them plan to hire anyone.
That is why this category scores low on pay and total value despite its volume. Only about 6% of the business applications filed in 2022 had become employer businesses (firms with a payroll) within a year, according to the same Census data, and a founder's own income does not appear in these statistics at all. What the data does show is that starting something has become a mainstream response to a tight market for white-collar jobs: founders, independent consultants and advisors now sit alongside AI engineers on the list of the fastest-growing job titles.
Why this matters: for people with deep expertise, starting a small business is now cheaper and more common than at any point on record, which makes it a realistic alternative to a job search in a shrinking field. How to apply this: start with a service you can sell to people who already know your work (consulting, a specialized product, a niche marketplace), keep costs near zero until it earns, and judge it on revenue within months rather than on the number of tools you have set up.
12. No. 10: Mental and behavioral health
Mental and behavioral health closes the top 10 as a category with strong, steady growth and modest pay. Substance abuse, behavioral disorder and mental health counselors are projected to grow from 533,400 to 631,400 jobs (+18.4%) by 2035 at a median of $59,350, and psychiatric technicians are the seventh-fastest-growing occupation in the country at +22.3% - BLS. Marriage and family therapists (+13.5%), clinical and counseling psychologists (+11.7%, median $100,580) and mental health social workers (+10.3%) all grow well above the 3.5% average for the economy.
The Bureau of Labor Statistics ties this growth to the "high prevalence of chronic diseases and behavioral health disorders in the general population", which it expects to keep driving demand to diagnose, treat and manage these conditions through 2035, and it projects community and social service occupations as the fourth-fastest-growing occupational group (+7.4%). The trend is international: the World Economic Forum lists social work and counselling professionals among the largest-growing jobs worldwide by 2030. On the clinical end, psychiatric nurse practitioners are the 19th-fastest-growing job title in LinkedIn's US ranking, and they combine this category's demand with the nurse practitioner pay discussed in section 3.
Pay is the trade-off. Counselors and psychiatric technicians earn well below the clinicians in section 3. The higher-paid routes in this field require graduate training (psychologists, psychiatric nurse practitioners, psychiatrists), and they are also the ones in highest demand for side work: this site's board lists 5 open AI-training roles for psychiatrists and 6 for psychologists today, reviewing how AI models handle clinical questions, each with the pay it states.
Why this matters: demand for mental health care is growing steadily and is hard to automate, because the work depends on trust and human judgment. How to apply this: a counseling or social work credential is a reliable entry, but the pay ceiling rises sharply with graduate training, so plan the path to a licensed clinical role early; experienced clinicians can add AI training work on the side, as described in section 9.
13. The fastest-declining jobs worldwide
The jobs shrinking fastest have one thing in common across almost every country and data source: they consist mainly of moving information from one form to another. Cashiers record sales, data entry clerks copy figures into systems, bank tellers process routine transactions, bookkeeping clerks reconcile records, and secretaries schedule, file and format. Each of those tasks is now done more cheaply by software, self-service and AI, so the work survives while the jobs that did it by hand do not. The same first-principles test from section 1 applies in reverse: when productivity in a task rises faster than demand for it, employment falls.
The World Economic Forum's employers expect exactly that pattern worldwide. They project the fastest declines by 2030, in percentage terms, for postal service clerks, bank tellers and related clerks, data entry clerks, cashiers and ticket clerks, and administrative assistants and executive secretaries, followed by printing workers and accounting, bookkeeping and payroll clerks - World Economic Forum. The drivers they name are broadening digital access, AI and information processing, and robots and autonomous systems. For the first time in the report's history, graphic designers and legal secretaries appear just outside the top 10 fastest-declining roles, which the report reads as a sign of generative AI's growing ability to perform knowledge work.
The fastest-growing and fastest-declining jobs worldwide, 2025-2030

The two halves of that chart are mirror images. Every role at the top builds or runs digital and AI systems; nearly every role at the bottom processes the information those systems now handle. In absolute numbers the biggest losses worldwide are in cashiers and ticket clerks and administrative assistants and executive secretaries, followed by building caretakers, cleaners and housekeepers, material-recording and stock-keeping clerks, and printing workers (see the chart in section 1). Employers are explicit about the cause: 40% of those surveyed expect to reduce their workforce where AI can automate tasks - World Economic Forum. They also expect the share of work tasks done mainly by humans alone to fall from 47% today to roughly a third by 2030.
The International Labour Organization's global index of exposure to generative AI points at the same occupations. About one in four workers worldwide are in an occupation with some exposure to generative AI, and 3.3% of global employment falls in the highest-exposure category, with clerical occupations showing the highest exposure of all - ILO. The exposure falls unevenly: 4.7% of women's employment is in the highest-exposure category against 2.4% of men's, and exposure is highest in high-income countries, where 34% of employment falls in one of the exposed categories. The ILO is careful to say that for most jobs the likely outcome is transformation of tasks rather than outright replacement.
The US projections put numbers on the decline. The Bureau of Labor Statistics expects office and administrative support occupations to shrink 4.0% by 2035 and lose 752,100 jobs, the most of any occupational group, as automation tools including AI are built into everyday work - BLS. By percentage, the steepest declines are for word processors and typists (-34.4%), telephone operators (-27.6%), switchboard operators (-26.0%) and data entry keyers (-25.5%). By number of jobs, these are the ten largest losses:
| Job | Jobs in 2025 | Change to 2035 | Change | Median pay |
|---|---|---|---|---|
| Cashiers | 3,106,300 | -200,600 | -6.5% | $32,880 |
| Office clerks, general | 2,600,000 | -156,200 | -6.0% | $45,010 |
| Customer service representatives | 2,666,000 | -141,800 | -5.3% | $44,770 |
| Secretaries and administrative assistants | 1,889,800 | -114,100 | -6.0% | $47,540 |
| Bookkeeping, accounting and auditing clerks | 1,532,400 | -85,600 | -5.6% | $50,670 |
| Shipping, receiving and inventory clerks | 827,700 | -62,800 | -7.6% | $45,260 |
| Retail sales supervisors | 1,419,800 | -52,500 | -3.7% | $48,520 |
| Bank tellers | 339,200 | -44,700 | -13.2% | $43,030 |
| Data entry keyers | 131,800 | -33,600 | -25.5% | $41,340 |
| Correctional officers and jailers | 397,800 | -29,500 | -7.4% | $58,940 |
Most of those losses fall on jobs that pay below the US median of $50,980, which makes the decline harder on the people affected than the raw numbers suggest. Measured the same way as the value chart in section 1, the shrinking of general office clerks, cashiers and customer service representatives alone removes about $20 billion a year of pay by 2035 - BLS. The secretaries in this table exclude legal, medical and executive secretaries, and the retail supervisors are first-line supervisors of retail sales workers.
Today's payroll data shows declines in a different set of places, and not all of them are about AI. In the 12 months to September 2026, US government employment fell by 216,000, finance and insurance lost 93,300 jobs, and the information sector lost 120,000, including film and sound recording (-5.8%), publishing including software publishers (-3.6%) and data processing and hosting (-4.7%). The federal government is also projected to shrink 3.4% by 2035. Some of these losses reflect AI-driven productivity, some reflect public budget decisions, and some reflect the unwinding of the hiring boom of 2021 and 2022.
That boom shows up most clearly in software development, which is where AI's effect on a skilled job is easiest to measure across countries. Indeed's index of software development job postings (February 2020 = 100) peaked in 2022 in all six of the large economies shown below and has since fallen by 61% to 71% from those peaks. In September 2026, postings in Germany stood at less than half their pre-pandemic level - FRED, France and the UK were well below it, the US and Canada were about 23% below it, and only Australia was above it.
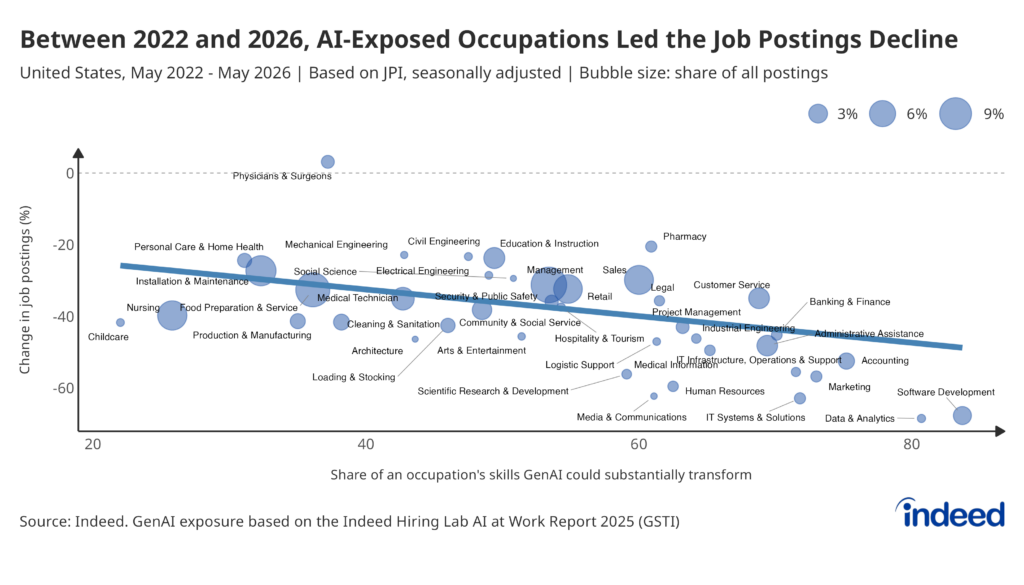
The peaks behind these numbers are a warning against reading every decline as AI. Postings everywhere were inflated in 2022 (the US index reached about 234, more than double its pre-pandemic level), so part of each drop is a return to normal. But Indeed's own analysis finds a clear AI signal inside the decline: across US occupations, the more exposed an occupation is to generative AI, the more its job postings fell between May 2022 and May 2026, with software development, data and analytics, and IT systems among the steepest declines. The chart below shows that relationship. Indeed adds an important twist: over the past year the relationship flipped, and the most AI-exposed occupations have generally rebounded the most - Indeed Hiring Lab.
AI-exposed occupations led the job postings decline, 2022-2026
The people feeling the decline most are young workers entering exposed fields. Stanford's Digital Economy Lab, using ADP payroll data on millions of US workers, finds that employment of 22-to-25-year-olds in the most AI-exposed occupations now stands about 19% below where it would be if it had kept pace with their peers in less-exposed occupations, up from 15% a year earlier, while experienced workers show no comparable gap - Stanford Digital Economy Lab. The adjustment runs mainly through reduced hiring of young workers rather than layoffs. The authors are careful about cause: they note the gap shrinks when education is accounted for and that the estimates have become more sensitive to method, which raises legitimate questions about how much of the pattern AI causes.
Put together, the evidence on decline points to four groups of work at risk:
- Routine clerical work: data entry, filing, bookkeeping, payroll and general office clerks
- Front-line transaction roles: cashiers, tellers, ticket clerks and telemarketers
- Entry-level knowledge work: junior roles in software, customer service and analysis
- Some creative production: graphic design and print, where generative AI does part of the task
The common thread is not "office work" or "tech work" but routine work in which the output can be checked against a clear standard. Jobs that combine a routine core with judgment, responsibility or physical presence are adapting rather than disappearing, which is why the WEF finds clerical roles shrinking while project managers and operations managers grow, and why the US projections show bookkeeping clerks falling while financial managers rise. Inside almost every declining job there is an adjacent growing one that uses the same knowledge with more judgment attached.
It is also worth knowing what a high exposure score does not mean. When the Bureau of Labor Statistics published its new AI exposure categories alongside the 2025-2035 projections, it stated plainly that a "High" or "Very high" exposure rating "does not necessarily mean employment will decline", and that an exposure category is not a forecast of jobs, wages or replacement - BLS. Exposure tells you that the work will change. Whether the job shrinks depends on whether demand for the output grows faster than AI raises productivity, which is the same test this guide applies everywhere.
Why this matters: the declines are concentrated, predictable and mostly slow, which gives people in exposed jobs time to move if they start early. How to apply this: if your job is in one of the four groups above, look for the adjacent growing role that uses your existing knowledge (from medical records to reimbursement, from bookkeeping to financial analysis, from customer service to AI evaluation work, from junior coding to AI-assisted engineering), and make the move while your experience is still current.
14. The 100 fastest-growing jobs, with numbers
The full ranking below covers every detailed occupation in the official US projections. It takes all 831 occupations in the Bureau of Labor Statistics' 2025-2035 projections, ranks them by projected percent growth (ties broken by the number of jobs added), and keeps the top 100 - BLS. For each job it shows how many people did it in 2025, how many jobs it is projected to add by 2035, the growth rate and the 2025 median annual pay. The US is the only large economy that publishes projections at this level of detail for hundreds of occupations, which is why this list is American; the global sources earlier in this guide show that most of the same fields are growing worldwide.
Read the growth column and the jobs column together, for the reasons explained in section 1. Together the 100 jobs on this list are projected to add 3.75 million jobs, about 63% of all the growth the US expects over the decade, and 84 of them pay more than the US median of $50,980. But the counts vary enormously: 16 of the jobs add 50,000 or more positions each, while 27 add fewer than 5,000 each. Health and care work dominates the list, with 41 of the 100 jobs, followed by computer, data, science and engineering roles and then the skilled trades that install and repair equipment. A job's place on this list says how fast it is growing; only the jobs column says how much room there is to get in.
| # | Job | Jobs in 2025 | Added by 2035 | Growth | Median pay (2025) |
|---|---|---|---|---|---|
| 1 | Nurse practitioners | 336,300 | +137,800 | 41.0% | $132,300 |
| 2 | Solar photovoltaic installers | 31,100 | +11,300 | 36.5% | $53,140 |
| 3 | Data scientists | 275,600 | +95,400 | 34.6% | $120,230 |
| 4 | Wind turbine service technicians | 11,800 | +3,500 | 29.5% | $64,120 |
| 5 | Medical and health services managers | 640,400 | +155,100 | 24.2% | $123,860 |
| 6 | Physical therapist assistants | 114,100 | +26,200 | 23.0% | $68,380 |
| 7 | Psychiatric technicians | 161,500 | +36,000 | 22.3% | $45,130 |
| 8 | Computer and information research scientists | 38,600 | +8,400 | 21.8% | $140,300 |
| 9 | Occupational therapy assistants | 52,200 | +11,200 | 21.5% | $72,300 |
| 10 | Ophthalmic medical technicians | 72,500 | +15,500 | 21.4% | $45,570 |
| 11 | Physician assistants | 168,900 | +35,700 | 21.1% | $135,880 |
| 12 | Information security analysts | 192,900 | +40,600 | 21.0% | $129,180 |
| 13 | Occupational health and safety technicians | 31,200 | +6,100 | 19.4% | $61,560 |
| 14 | Hearing aid specialists | 11,200 | +2,200 | 19.4% | $65,160 |
| 15 | Epidemiologists | 12,800 | +2,400 | 18.7% | $87,220 |
| 16 | Occupational health and safety specialists | 143,100 | +26,400 | 18.5% | $90,150 |
| 17 | Substance abuse, behavioral disorder, and mental health counselors | 533,400 | +98,000 | 18.4% | $59,350 |
| 18 | Home health and personal care aides | 4,677,100 | +847,300 | 18.1% | $35,800 |
| 19 | Health specialties teachers, postsecondary | 278,400 | +49,900 | 17.9% | $107,310 |
| 20 | Industrial machinery mechanics | 446,900 | +79,700 | 17.8% | $64,520 |
| 21 | Logisticians | 255,100 | +44,900 | 17.6% | $82,320 |
| 22 | Nursing instructors and teachers, postsecondary | 96,100 | +16,500 | 17.1% | $80,250 |
| 23 | Speech-language pathologists | 193,400 | +32,100 | 16.6% | $97,870 |
| 24 | Health information technologists and medical registrars | 42,000 | +6,700 | 15.9% | $68,020 |
| 25 | Computer and information systems managers | 685,800 | +108,100 | 15.8% | $175,140 |
| 26 | Massage therapists | 155,400 | +23,700 | 15.3% | $58,450 |
| 27 | Occupational therapists | 169,600 | +25,200 | 14.8% | $100,330 |
| 28 | Diagnostic medical sonographers | 92,200 | +12,900 | 13.9% | $96,590 |
| 29 | Marriage and family therapists | 76,300 | +10,300 | 13.5% | $66,940 |
| 30 | Forensic science technicians | 20,100 | +2,700 | 13.3% | $72,060 |
| 31 | Forest fire inspectors and prevention specialists | 3,000 | +400 | 13.1% | $56,870 |
| 32 | Medical assistants | 833,900 | +107,600 | 12.9% | $45,690 |
| 33 | Orthotists and prosthetists | 9,500 | +1,200 | 12.9% | $81,110 |
| 34 | Exercise physiologists | 21,200 | +2,700 | 12.8% | $59,460 |
| 35 | Community health workers | 64,700 | +8,200 | 12.7% | $51,850 |
| 36 | Athletic trainers | 35,200 | +4,400 | 12.7% | $62,520 |
| 37 | Medical scientists, except epidemiologists | 181,000 | +22,700 | 12.6% | $103,410 |
| 38 | Medical equipment repairers | 71,800 | +9,100 | 12.6% | $61,660 |
| 39 | Therapists, all other | 56,100 | +7,100 | 12.6% | $77,930 |
| 40 | Industrial engineers | 365,100 | +45,400 | 12.4% | $102,440 |
| 41 | Biochemists and biophysicists | 35,200 | +4,300 | 12.3% | $127,410 |
| 42 | Cooks, restaurant | 1,417,500 | +171,400 | 12.1% | $37,390 |
| 43 | Animal caretakers | 365,300 | +44,100 | 12.1% | $35,360 |
| 44 | Physical therapists | 283,700 | +33,800 | 11.9% | $102,760 |
| 45 | Operations research analysts | 113,100 | +13,500 | 11.9% | $88,940 |
| 46 | Aerospace engineering and operations technologists and technicians | 11,600 | +1,400 | 11.9% | $82,890 |
| 47 | Clinical and counseling psychologists | 81,300 | +9,500 | 11.7% | $100,580 |
| 48 | Taxi drivers | 204,200 | +23,500 | 11.5% | $42,100 |
| 49 | Nurse midwives | 8,200 | +900 | 11.5% | $134,040 |
| 50 | Mechanical engineers | 298,500 | +33,500 | 11.2% | $104,110 |
| 51 | Statisticians | 31,300 | +3,400 | 11.0% | $105,650 |
| 52 | Audiologists | 14,200 | +1,600 | 11.0% | $95,780 |
| 53 | Heating, air conditioning, and refrigeration mechanics and installers | 440,900 | +48,200 | 10.9% | $61,010 |
| 54 | Training and development specialists | 472,500 | +51,100 | 10.8% | $69,280 |
| 55 | Medical equipment preparers | 79,900 | +8,700 | 10.8% | $47,700 |
| 56 | Farm equipment mechanics and service technicians | 41,900 | +4,500 | 10.7% | $56,550 |
| 57 | Genetic counselors | 4,200 | +400 | 10.4% | $100,040 |
| 58 | Mental health and substance abuse social workers | 138,900 | +14,300 | 10.3% | $60,280 |
| 59 | Electrical power-line installers and repairers | 131,900 | +13,600 | 10.3% | $95,320 |
| 60 | Software developers | 1,717,800 | +174,700 | 10.2% | $135,980 |
| 61 | Management analysts | 1,077,100 | +109,200 | 10.1% | $101,860 |
| 62 | Electrical engineers | 199,700 | +19,800 | 9.9% | $120,630 |
| 63 | Tile and stone setters | 45,200 | +4,400 | 9.8% | $55,690 |
| 64 | Financial managers | 879,700 | +84,900 | 9.7% | $166,570 |
| 65 | Nurse anesthetists | 54,500 | +5,300 | 9.7% | $236,590 |
| 66 | Agents and business managers of artists, performers, and athletes | 26,900 | +2,600 | 9.7% | $82,890 |
| 67 | Electrical and electronics repairers, powerhouse, substation, and relay | 20,900 | +2,000 | 9.7% | $103,020 |
| 68 | Recreational vehicle service technicians | 17,500 | +1,700 | 9.7% | $52,000 |
| 69 | Optometrists | 45,100 | +4,300 | 9.5% | $136,570 |
| 70 | Veterinary technologists and technicians | 131,400 | +12,300 | 9.4% | $47,380 |
| 71 | Veterinarians | 91,100 | +8,600 | 9.4% | $130,100 |
| 72 | Database architects | 69,500 | +6,500 | 9.4% | $139,500 |
| 73 | Avionics technicians | 19,800 | +1,900 | 9.4% | $82,280 |
| 74 | Financial examiners | 70,000 | +6,500 | 9.3% | $94,160 |
| 75 | Electricians | 821,000 | +75,900 | 9.2% | $63,190 |
| 76 | Manicurists and pedicurists | 201,800 | +18,600 | 9.2% | $35,760 |
| 77 | Actuaries | 31,200 | +2,900 | 9.2% | $130,000 |
| 78 | Aircraft cargo handling supervisors | 9,700 | +900 | 9.2% | $58,170 |
| 79 | Construction managers | 609,100 | +55,200 | 9.1% | $114,990 |
| 80 | Veterinary assistants and laboratory animal caretakers | 132,100 | +12,000 | 9.1% | $38,150 |
| 81 | Computer hardware engineers | 76,100 | +6,900 | 9.1% | $161,740 |
| 82 | Floor layers, except carpet, wood, and hard tiles | 29,800 | +2,700 | 9.0% | $56,460 |
| 83 | Stockers and order fillers | 2,804,300 | +250,700 | 8.9% | $37,330 |
| 84 | Flight attendants | 133,700 | +11,800 | 8.8% | $63,580 |
| 85 | Skincare specialists | 104,200 | +9,100 | 8.8% | $45,330 |
| 86 | Chiropractors | 61,700 | +5,300 | 8.7% | $79,200 |
| 87 | Agricultural equipment operators | 66,900 | +5,700 | 8.6% | $41,730 |
| 88 | Acupuncturists | 14,800 | +1,300 | 8.6% | $76,040 |
| 89 | Healthcare social workers | 194,800 | +16,500 | 8.5% | $67,880 |
| 90 | Respiratory therapists | 142,000 | +12,100 | 8.5% | $82,280 |
| 91 | Airline pilots, copilots, and flight engineers | 104,600 | +8,700 | 8.3% | $232,140 |
| 92 | Aerospace engineers | 68,700 | +5,700 | 8.3% | $134,960 |
| 93 | Materials scientists | 8,600 | +700 | 8.3% | $117,790 |
| 94 | Natural sciences managers | 112,200 | +9,200 | 8.2% | $167,220 |
| 95 | Semiconductor processing technicians | 31,200 | +2,600 | 8.2% | $51,430 |
| 96 | Couriers and messengers | 228,900 | +18,200 | 8.0% | $39,200 |
| 97 | Dental hygienists | 225,300 | +17,900 | 8.0% | $98,100 |
| 98 | Computer systems analysts | 544,400 | +42,900 | 7.9% | $105,850 |
| 99 | Driver/sales workers | 442,900 | +35,200 | 7.9% | $38,770 |
| 100 | Medical records specialists | 200,700 | +15,600 | 7.8% | $51,140 |
Three clusters account for most of the list, and each matches a force from section 1. The health and care cluster runs from nurse practitioners at No. 1 through therapy roles, technicians, counselors and medical assistants, and it is driven by aging and chronic disease. The AI and digital cluster includes data scientists (No. 3), computer and information research scientists (No. 8), information security analysts (No. 12), IT managers (No. 25), operations research analysts, software developers (No. 60) and database architects. The energy and equipment cluster includes solar installers (No. 2), wind turbine technicians (No. 4), industrial machinery mechanics (No. 20), HVAC mechanics, power-line installers, electrical engineers and electricians (No. 75), the trades that the electrification of everything and the AI buildout both need. Outside those clusters, a handful of service jobs appear because of sheer demand, such as restaurant cooks, animal caretakers, massage therapists and taxi drivers.
There are two caveats worth knowing before you use the list. First, the projections are the Bureau's best estimate and, as it notes itself, the direction and relative size of each change matter more than the exact figure; the Bureau applies adjustments for new technologies conservatively, only where there is convincing evidence of a long-term change, and it published separate AI exposure categories alongside the projections so readers can judge each occupation's exposure for themselves. Second, a percent ranking cannot show how hard a job is to enter: nurse practitioners need a graduate degree, while restaurant cooks need none. For hiring right now rather than over a decade, LinkedIn's list of the 25 fastest-growing job titles is the best complement to this table, and it is led by AI engineers, AI consultants, new home sales specialists, data annotators and AI and machine learning researchers.
Why this matters: this is the most complete public list of where job growth is expected, and it is easy to misread without the counts. How to apply this: shortlist jobs that appear here and also add a meaningful number of positions, then check the entry requirements and the pay in your own state, because national medians hide large regional differences.
15. How to use this ranking
The right move depends less on which category ranks highest and more on what you already bring. Every category in this guide rewards a specific asset: a clinical license, a trade license, technical depth, domain expertise or the appetite to build something of your own. People who try to enter a category without its core asset tend to land in its lowest-paid, most crowded tier, while people who bring the asset can move quickly to the well-paid work. The useful question is therefore "which growing category values what I have, or what I can get within a year or two?"
The second question is timing. Health and care demand will grow for decades, so training for it pays off over a long horizon. The AI buildout is creating trade jobs right now but follows an investment cycle that will eventually slow, so the strongest position there is a license that transfers to other construction and power work. AI engineering and AI training reward people who can move quickly, because the work is changing month by month. The diagram below turns these questions into a simple decision path.
Start from your strongest asset, not from the top of the ranking
Each path in the diagram leads to a category in the top 10 that values the asset you start with. If you have no single strong asset yet, the fastest-growing entry points are care work and trade apprenticeships, because they pay while you train and both lead to licensed roles higher up the same ladder. If you have expertise but want to keep your current job, expert AI training work is the most flexible way to earn from it now: the platform directory on this site compares the companies doing this hiring and the guide to getting paid to train AI explains which platforms are legitimate, what the work pays and how contractors are paid.
A few rules of thumb hold across every path in this guide. Check all three numbers (growth rate, jobs added and median pay) before you trust any ranking, including this one. Prefer credentials that travel, because a license that works in several industries outlasts any single boom, the AI buildout included. Move toward judgment: within almost every field, the roles growing fastest are the ones that add responsibility to routine work, while the purely routine version of the same job shrinks. Watch the payroll data, because current hiring is a better guide to the next two years than any ten-year forecast. And start before you need to: declines in exposed jobs are gradual, which rewards the people who move while their experience is still current.
None of these rules depend on predicting exactly how AI will develop. They depend only on the patterns that the data in this guide shows across countries and sources: care and physical work keep growing because demand for them rises faster than productivity, roles that apply judgment to AI are growing while routine information work shrinks, and the people who gain most are those who combine a scarce credential with the ability to use new tools. If you take one thing from the ranking, take that combination.
Why this matters: a ranking is only useful if it changes a decision, and most career decisions fail because people chase the top of a list instead of the category that fits them. How to apply this: pick the path in the diagram that starts from your strongest asset, use the top 100 list in section 14 to choose specific jobs inside it, and check the live pay and hiring data before you commit time or money.
How this guide was researched
This guide was compiled on October 6, 2026. Current hiring figures come from US payroll data for the 12 months to September 2026, published by the Bureau of Labor Statistics. Long-term figures come from the Bureau's 2025-2035 employment projections, released on August 27, 2026. International figures come from the World Economic Forum's Future of Jobs Report 2025, the International Labour Organization's 2025 update on generative AI exposure, PwC's 2026 Global AI Jobs Barometer, LinkedIn's 2026 Jobs on the Rise lists and Indeed's job postings data. Figures about AI training work come from this site's own live job board, which re-reads each platform's public job feed every day, and are read again each time this page loads; the methods are explained on the methodology page. The scores in the top 10 table and the "new yearly pay" figures (projected new jobs multiplied by median pay) are this guide's own calculations from those sources.
The guide was compiled by Yuma Heymans (@yumahey), the founder of AITraining.jobs and co-founder of the AI recruitment platform HeroHunt.ai, who has spent years mapping how AI-training and data work is sourced, staffed and paid.
This guide reflects labor market data available on October 6, 2026. Job markets, projections and pay change quickly, so check the linked sources for the latest figures before making a career or hiring decision.